How we automated our recon at scale
Because piping commands together is not the answer.
Recon is the part of security research some people like and some don’t, but if you want to find vulnerabilities that’s a step you need to go through.
Most bug bounty hunters rely on the same tooling stack: subfinder, httpx, amass, massdns, etc. all connected through bash or python scripts. This works for single domains but becomes painfully slow when targeting programs with thousands of assets.
We spent years building and rebuilding PoC infrastructures, each one teaching us something new as we searched for a recon platform that could handle massive scale. We solved this by rethinking recon infrastructure entirely. Instead of piping tools together, we built a system that processes billions of public assets and centralizes everything in one searchable platform: profundis.io.
The story
As bug hunters, like everyone, we tried using tools available on GitHub. When processing recon data at scale, it resulted in:
- A lot of time spent to build wrappers around these tools and handle their output;
- Unmaintainable infrastructures when using automation frameworks that work for short recon periods but fail with 24/7 continuous reconnaissance;
- Unpredictable resource consumption (CPU and memory), causing scalability issues.
We experimented with several different architectures to store our data. First, we tried a PostgreSQL cluster in combination with pg_cron to automatically trigger tasks when new data appeared in specific tables. Later, we switched to Logstash combined with the Jdbc input plugin and Jdbc filter plugin for the data ingestion. Even after optimizing our PostgreSQL instances, adding indexes to most columns and following the best practices, we still faced major issues: search performance was bad, data deletion took forever when we needed it, and making any changes to the tables schema and making it match our code was time consuming.
The challenge was clear: we needed to process and enrich massive amounts of data, store it efficiently, and make everything instantly searchable, and all of this while handling thousands of assets through our ingest pipeline every second.
What we built
Finally, we came up with the following architecture:
- RabbitMQ queues buffering the data to process.
- Nomad jobs (Docker containers) processing data chunk by chunk.
- Consul service mesh to connect the allocations (jobs) with each other.
- Network traffic routed to a global load balancer via GRE/IPsec tunnels.
- One DNS load balancer per datacenter / VPC.
- A relational PSQL database to store ASN data and other lightweight information.
- A Redis server to deduplicate the data and cache assets we already processed.
 Global recon architecture
To handle all the different data enrichment processes and distribute load efficiently across our infrastructure, we needed a container orchestrator. We chose Nomad by HashiCorp (recently acquired by IBM) because it offers 99% of Kubernetes features with significantly less complexity (built-in UI, easily submit jobs without having to deal with yaml files, etc). Bye bye ingress controllers and unmaintainable on premises clusters.
A Nomad cluster consists of servers that manage cluster state and clients that execute jobs. Each job can contain multiple tasks using different drivers. We only use Docker and sometimes batch jobs for short tasks.
We built a Golang tool for each data processing action (DNS resolution, ASN detection, etc) and containerized them. Each tool runs as a Nomad job, consumes messages from RabbitMQ queues, processes the data, and pushes results to output queues for continuous processing.
ASN (Autonomous System Number) is a unique identifier assigned to networks on the internet. It tells you which organization or ISP owns and operates a particular block of IP addresses.
This design scales horizontally by adding Nomad clients. Our entire reconnaissance operation runs on 200GB memory and 150GHz CPU (these values are reserved resources and the actual usage is around 55%).
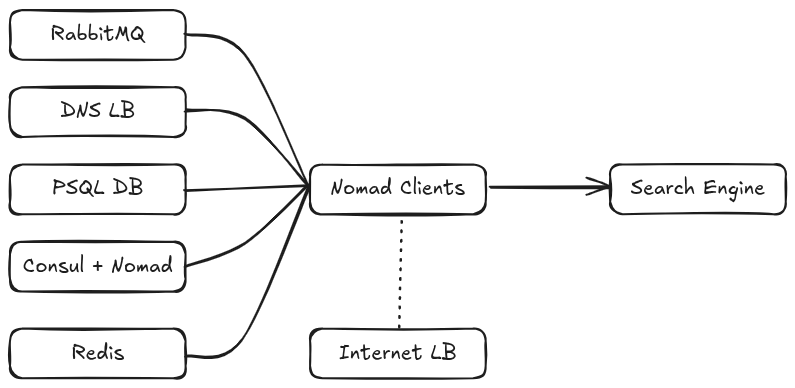
The Nomad clients have access to Redis, RabbitMQ queues/exchanges, our PSQL DB and our DNS load balancer. Their network traffic is transparently routed to our global loadbalancer.
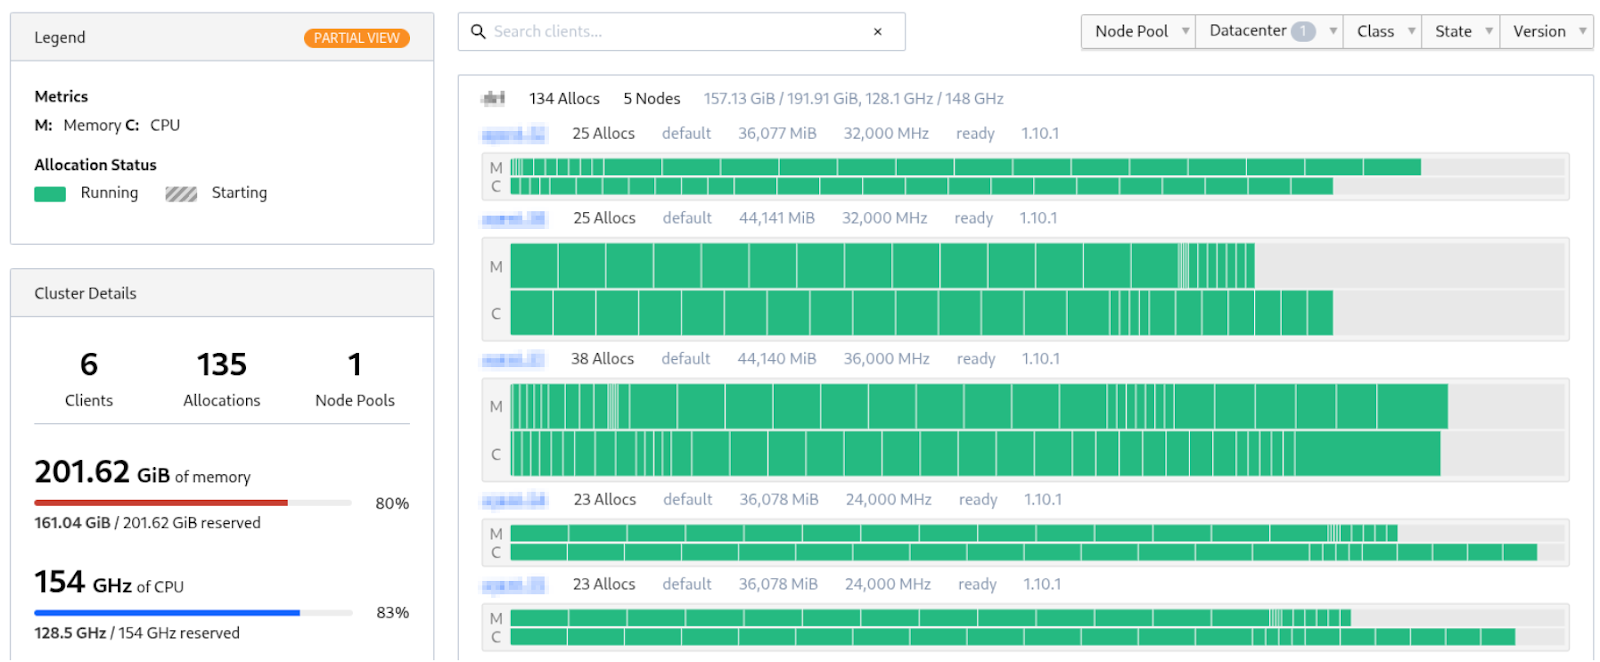 HashiCorp Nomad Topology view
How the containers talk to each other
Some workflows require direct container communication beyond RabbitMQ queues. While Docker containers on the same machine communicate easily through shared networks, cross-machine communication requires a service mesh tool like Consul.
RabbitMQ is a message broker that acts like a postal system for your applications. It receives, stores, and delivers data between different parts of your system, keeping everything organized even when processing thousands of messages per second.
When we started using Consul years ago, the documentation was outdated and we often had to dig through GitHub issues to make things work. The docs have since improved significantly.
To connect a container to Consul, you need to register it on Sidecar. Nomad calls the Consul API to register the service, after which other containers can resolve xxx.consul to get the container IP and port. Consul automatically excludes unhealthy instances based on Docker healthchecks, returning only healthy services IPs.
DNS resolution at scale
We built our DNS load balancer using the miekg/dns Golang library on a dedicated VM. It maintains an 8GB memory cache to avoid reresolving duplicate records. We chose this library for its efficiency and because our entire toolchain is already written in Go.
The load balancer currently handles 5k to 7k requests per second with spikes up to 12k rps. Despite the high packets rate, the network traffic remains low thanks to the DNS cache. Some tools can handle a rate 100x higher, but we prefer to throttle our process and ensure a fair usage of the public DNS servers.
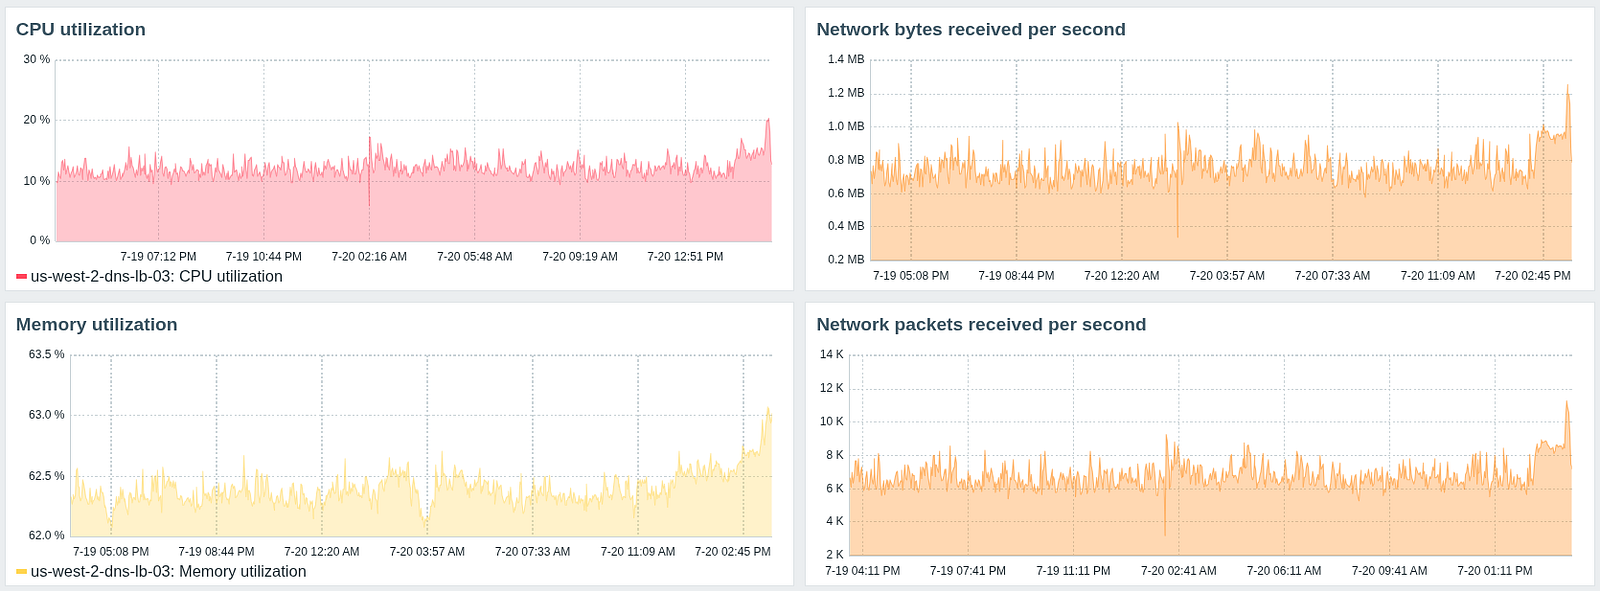 DNS loadbalancer monitoring statistics
On the system level, netdev_budget has been increased from 300 to 2048 to improve network packet processing during DNS resolution requests bursts. The UDP buffers size didn’t even need to be increased as the default values were fine.
How we use Redis
We use Redis as a deduplication cache to prevent reprocessing the same assets. Each hostname gets checked against Redis, and if not present, we add it with a TTL and process it. If the value already present, we skip it. The TTL ensures assets get processed again after the cache expires.
TTL (Time To Live) sets an expiration time on cached data. After the TTL expires, the data gets automatically deleted, forcing a fresh lookup next time.
A 12GB RAM cache stores approximately 80 million hostnames (including Redis metadata). As you can see on the graphs below, the CPU usage remains low as our ops rate is pretty low compared to what Redis can handle.
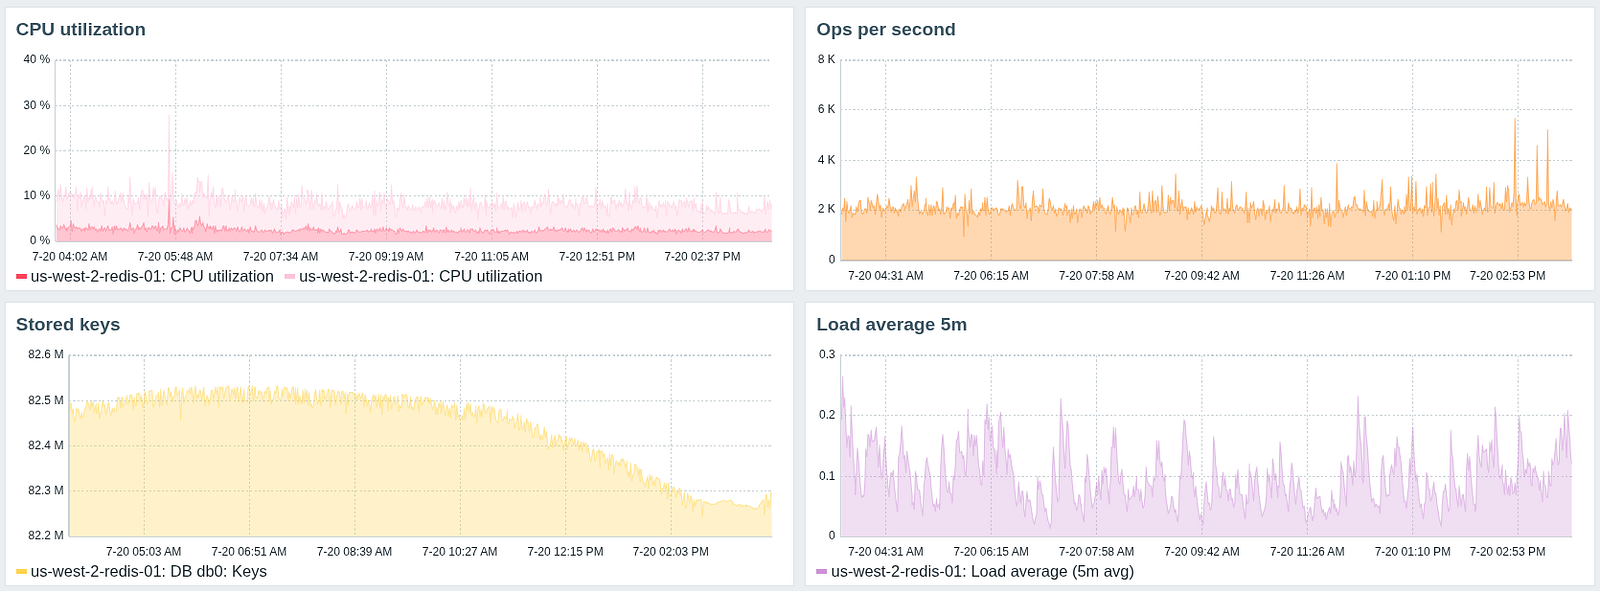 Redis monitoring statistics
Take control of your browser
As part of security research, you probably already use tools that automatically navigate web pages to collect URLs or perform various actions to discover XSS and other vulnerabilities. These tools work fine for occasional manual execution, but they can’t be scaled as we need.
That’s when tools like chromedp or go-rod come in, they are CDP (Chrome DevTools Protocol) drivers.
CDP (Chrome DevTools Protocol) is a debugging protocol that lets external tools remotely control Chromium-based browsers. It enables automation, debugging, and low-level browser interaction.
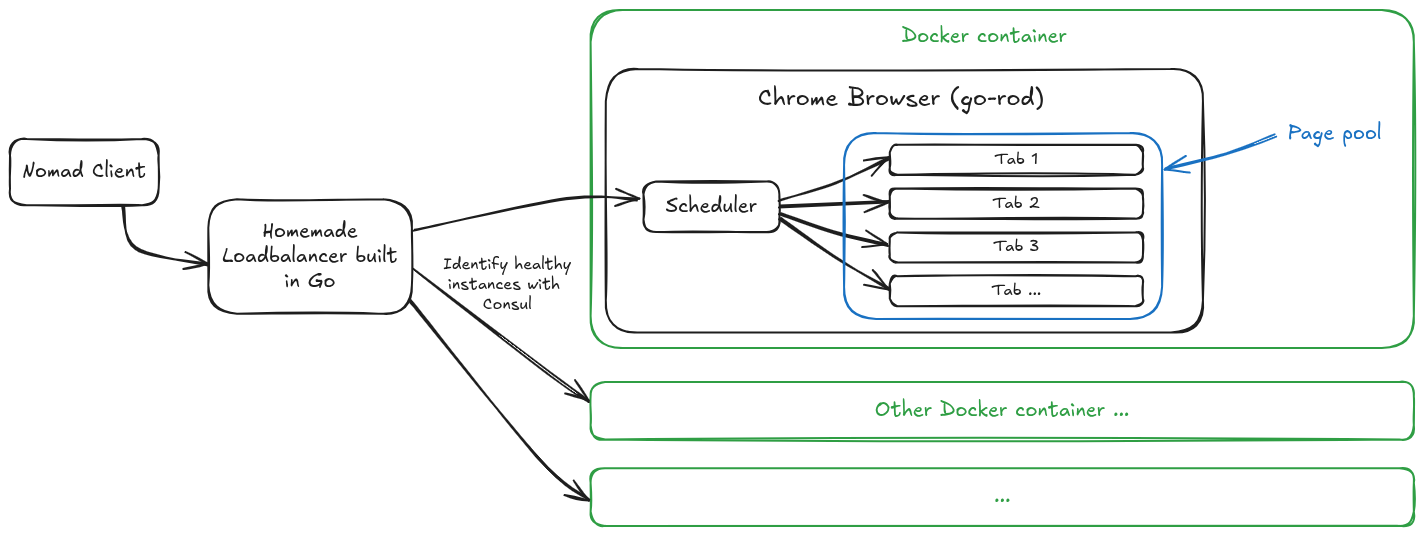
We built the following architecture. All interactions between components are made through Consul. When a tool needs to browse a web page, it first connects to the load balancer which redirects the request to the least busy docker instance (with the least connections). The task then arrives at the Chrome container internal scheduler which uses one of the available pages (tabs) to process the web rendering task and send back the result. The load balancer communicates with the chrome instance using an API.
Chrome loadbalancing architecture
The Page Pool is a built-in feature of go-rod so you don’t even have to build it yourself. With this topology, it is possible to scale indefinitely by adding new Chrome Docker containers.
With the DevTools Protocol and such a browser, you can accomplish almost any action you want: intercept network requests and modify them on the fly (like Burp), use the Stealth features to trigger far less anti-bot detections / WAFs, and change your device type (phone, laptop, etc.) as well as the screen dimensions and the user agent.
The Pros
Many different tools can make requests on web pages without hosting chrome locally which makes docker images lighter. Updating chromium just consists of updating the Docker image where chrome is running. Horizontal scaling is as simple as adding Nomad clients or resources. You can spread the chromium instances everywhere and let consul route all the requests for you. It is also possible to use an HTTP proxy (e.g. Squid) to cache static content and speed up the loading of the pages.
The Cons
Very high resource consumption (CPU and memory) as it is a real Chrome. You need to properly design the chrome instance code so that it handles cases where the page crashes or becomes unresponsive. The CDP is low level so it can be time consuming to understand how it works and develop your code.
What about internet traffic routing?
This part is pretty simple: Nomad clients traffic is routed through GRE tunnels to our main load balancer (hardware firewall/router). We were previously using PBR (Policy Based Routing) to properly route the traffic from the Nomad clients to the load balancer, but ended up using GRE tunnels everywhere as we have Nomad clients in multiple VPCs / datacenters. It made the configuration uniform and easier to maintain.
GRE tunnels create point-to-point connections over the internet. They wrap data packets so they can travel between different networks as if they were directly connected. This is just encapsulation without encryption, which makes it very bandwidth efficient.
The load balancer distributes traffic across a dozen outbound servers located in different areas of the globe while maintaining TCP session consistency by routing packets to the same destination IP through the same tunnel.
The LB to outbound server connections use IPsec tunnels instead of GRE since these servers also handle other workloads (Nomad Clients VMs also run on these servers) and connect our to two primary datacenters. SD-WAN provides ISP redundancy across all these IPsec tunnels if one of our WAN links fails.
IPsec tunnels encrypt network traffic between endpoints. They provide authentication and data integrity, ensuring packets can’t be read or modified while traveling over untrusted networks (internet).
The high volume of DNS resolutions and the huge amount of TCP sessions required kernel tuning on the outbound servers and Nomad Clients. We defined many custom sysctls but the most important was nf_conntrack_max that we bumped from 65 536 to 4 194 304 after we encountered connection drops under load (easily identified via the system journal). We also switched from cubic to BBR congestion control. Both changes improved the throughput and the global network stability.
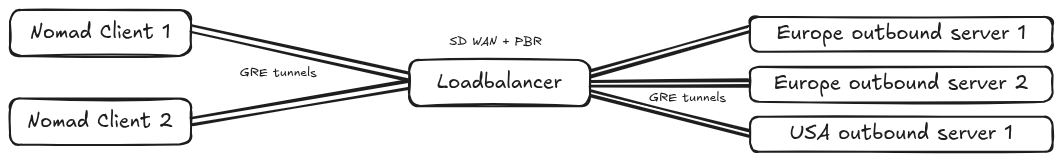 Nomad Clients to Internet Network Topology
For fun, we made a PoC to route our traffic transparently through the Tor network, and while being interesting to create, it was bad because:
- Tor exit nodes IPs are often blocked by WAFs, CDNs or firewalls;
- Even with loadbalancing traffic across dozens of entry nodes, the bandwidth was still extremely bad;
- And the most important reason: you slow down everything for all the Tor users.
What about scalability?
Since our input data volume is predictable, we provision enough containers to handle the workload. RabbitMQ queues buffer message spikes and data gets processed once the rate drops. In case of a variable workloads, Nomad Autoscaler can automatically scale container instances. We’ll likely implement this as our data volume continues growing.
We hit a bottleneck with our enterprise firewall during high DNS traffic (15k+ rps spikes). The firewall dnsproxy process was intercepting DNS requests for FQDN object resolution, but it wasn’t designed to handle that volume.
We had similar issues with regular TCP traffic not getting correctly NPU-offloaded when going through the outbound IPsec tunnels. Debugging these issues was a real pain and took way longer than expected, but once we got everything working properly, our firewall CPU usage dropped to under 5% instead of +60%.
NPU (Network Processing Unit) offloading moves packet processing from your main CPU to dedicated network chips. This makes everything much faster and keeps your CPU free for security tasks. There is a NPU on most hardware firewalls.
RabbitMQ was essential for handling our data processing. At this scale, you get sudden spikes where tons of data hits your system. In the screenshot below, messages are waiting to be consumed because of an input spike. RabbitMQ buffers everything so our pipeline doesn’t crash. All our data goes through RabbitMQ, from the sources to our search engine ingestion process. The stats on the profundis.io main page come directly from our RabbitMQ metrics.
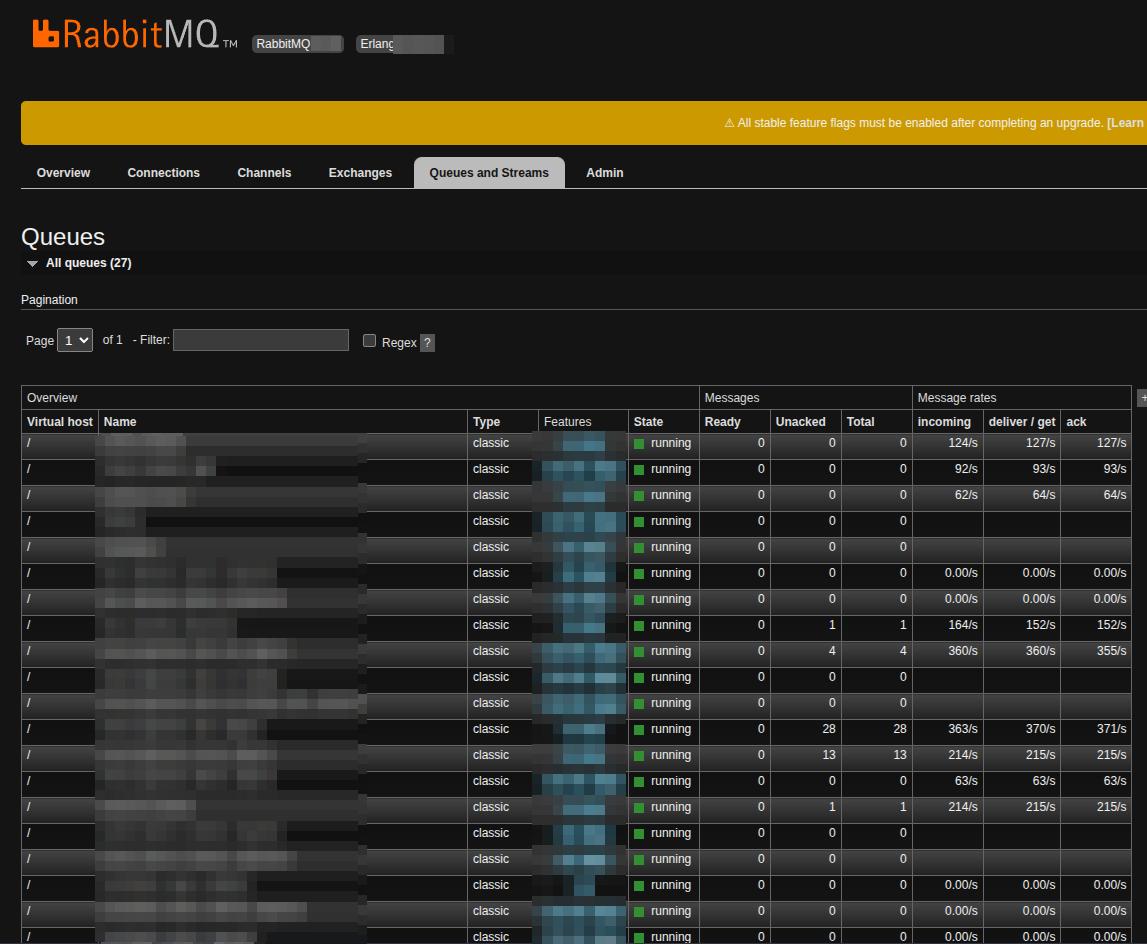 RabbitMQ admin dashboard
Managing dozens of physical servers and 60+ VMs requires automation. All our tools deploy via GitLab CI through staging + integration tests, then production. This saved us hours of work. This is also true for the monitoring as it is critical to get good visibility on your assets at this scale. We use Zabbix in combination with Prometheus and Grafana to get alerts when something goes wrong or when a threshold is reached.
We found that it was far more cost effective to run some of our resource heavy jobs on CSPs infrastructures, especially some data enrichment tasks which are CPU intensive.
- Use spot instances as much as you can for short lived tasks;
- Use the AWS Golang SDK in combination with CloudFormation templates;
- When you have a lot of network traffic between your EC2s, keep them in the same AZ and subnet to get free data transfer;
- Shutdown your instances automatically when you don’t need them and start them in your CI pipelines or using the Go SDK, it only takes a few seconds;
- Run only tasks which don’t cause too much egress (to internet) network traffic to avoid paying for data transfer;
- Configure AWS budget alerts to avoid overspending.
We were able to reduce our AWS bill with a factor of 4 with these simple steps.
Tips
- Keep things simple. Avoid complex tools and use easier alternatives when some are available (e.g. K8S vs Nomad).
- Even if a lot of open source tools exist and work well, they are usually not made to be used in an automated infrastructure like this. Just develop your own tools: you will improve your coding skills and be able to well control the resource usage (especially memory). More important, you will understand how they work and be able to make them evolve and easily add new features.
- Don’t try to make a tool do something it is not supposed to do. E.g. if you want to create a web crawler, give a look to tools like chromedp or go-rod instead of using Selenium. They will give you a more in depth control of the browser and have built-in stealth features.
The result: one platform to search for everything
We finally created the web app allowing us to search all of this public data in one place and get alerts as soon as an asset matching our criteria is discovered.
The queries are built using the DSL format which support wildcards as well as exact terms: host: *.example.com AND port:443.
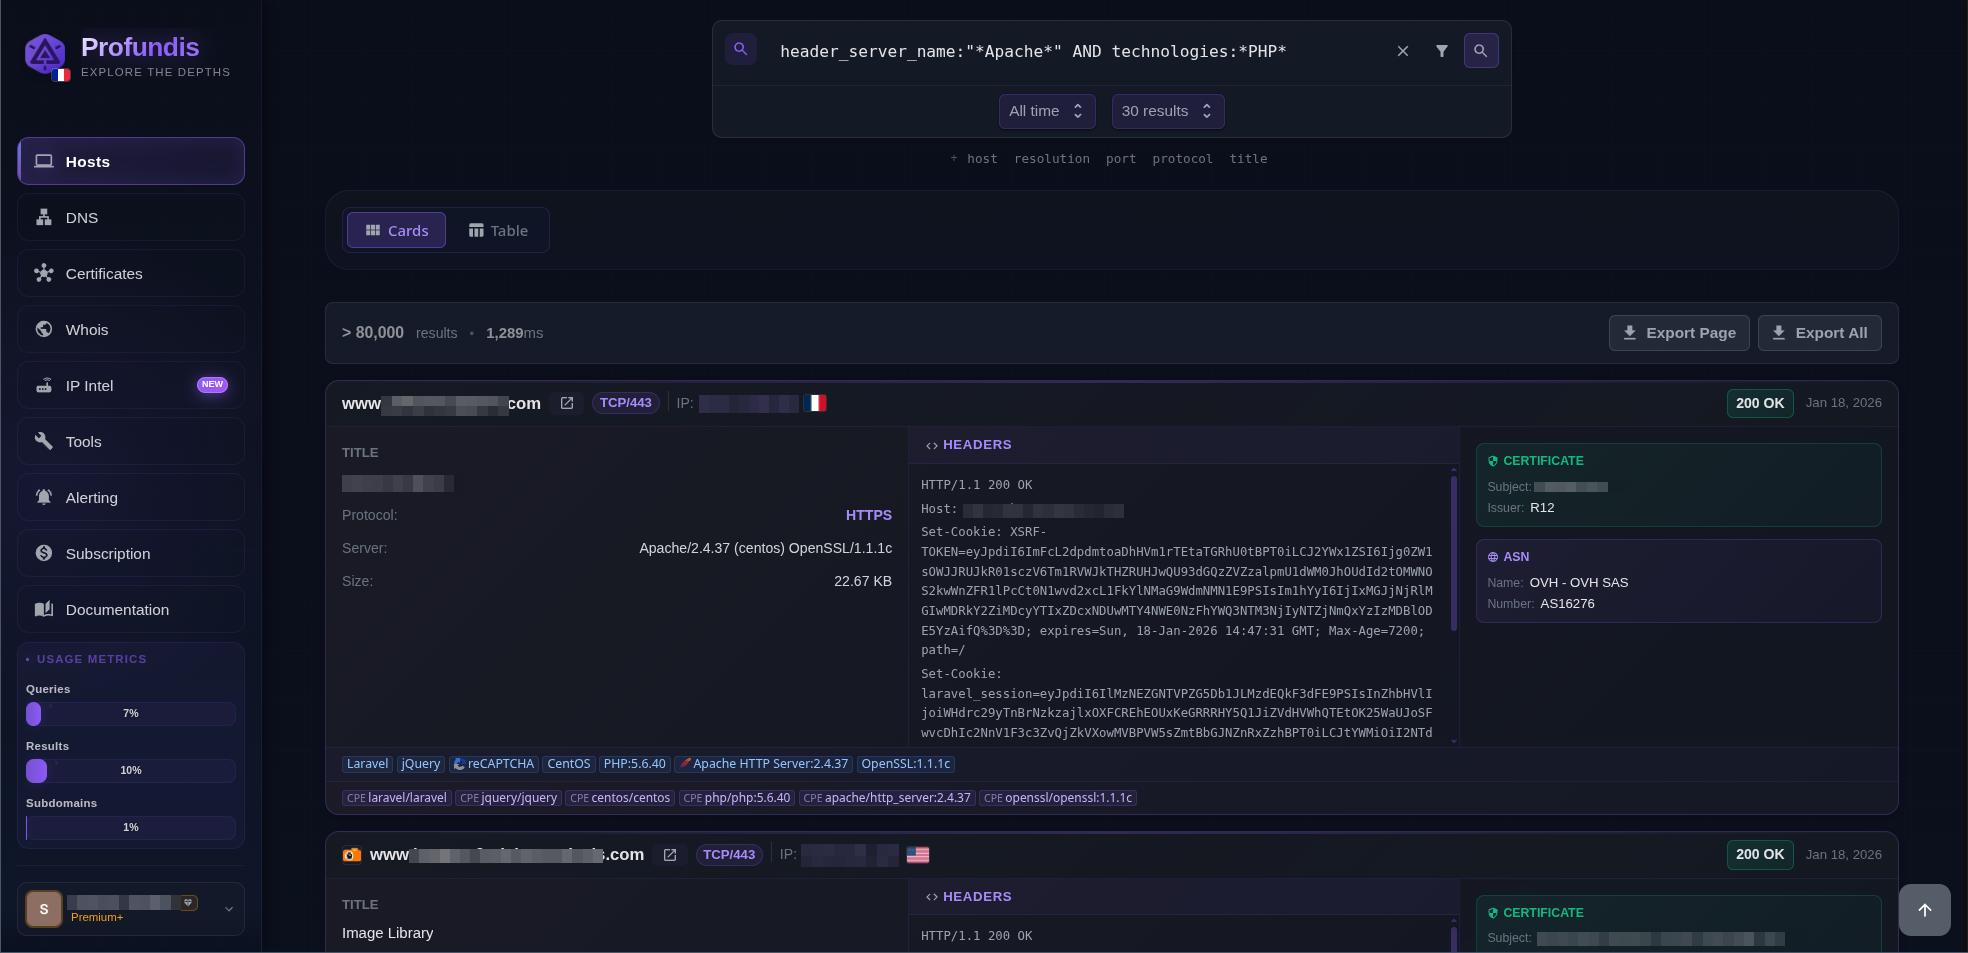 Hosts search on profundis.io
Our DNS records history database holds some pretty valuable intel for security research. You can dig up origin IPs from servers that are now sitting behind CDNs like Cloudflare or Akamai, plus discover alternative IPs where the same application might be running across different environments (think dev, QA, preprod setups). We built in a subdomain enumeration API endpoint to make this data easily accessible.
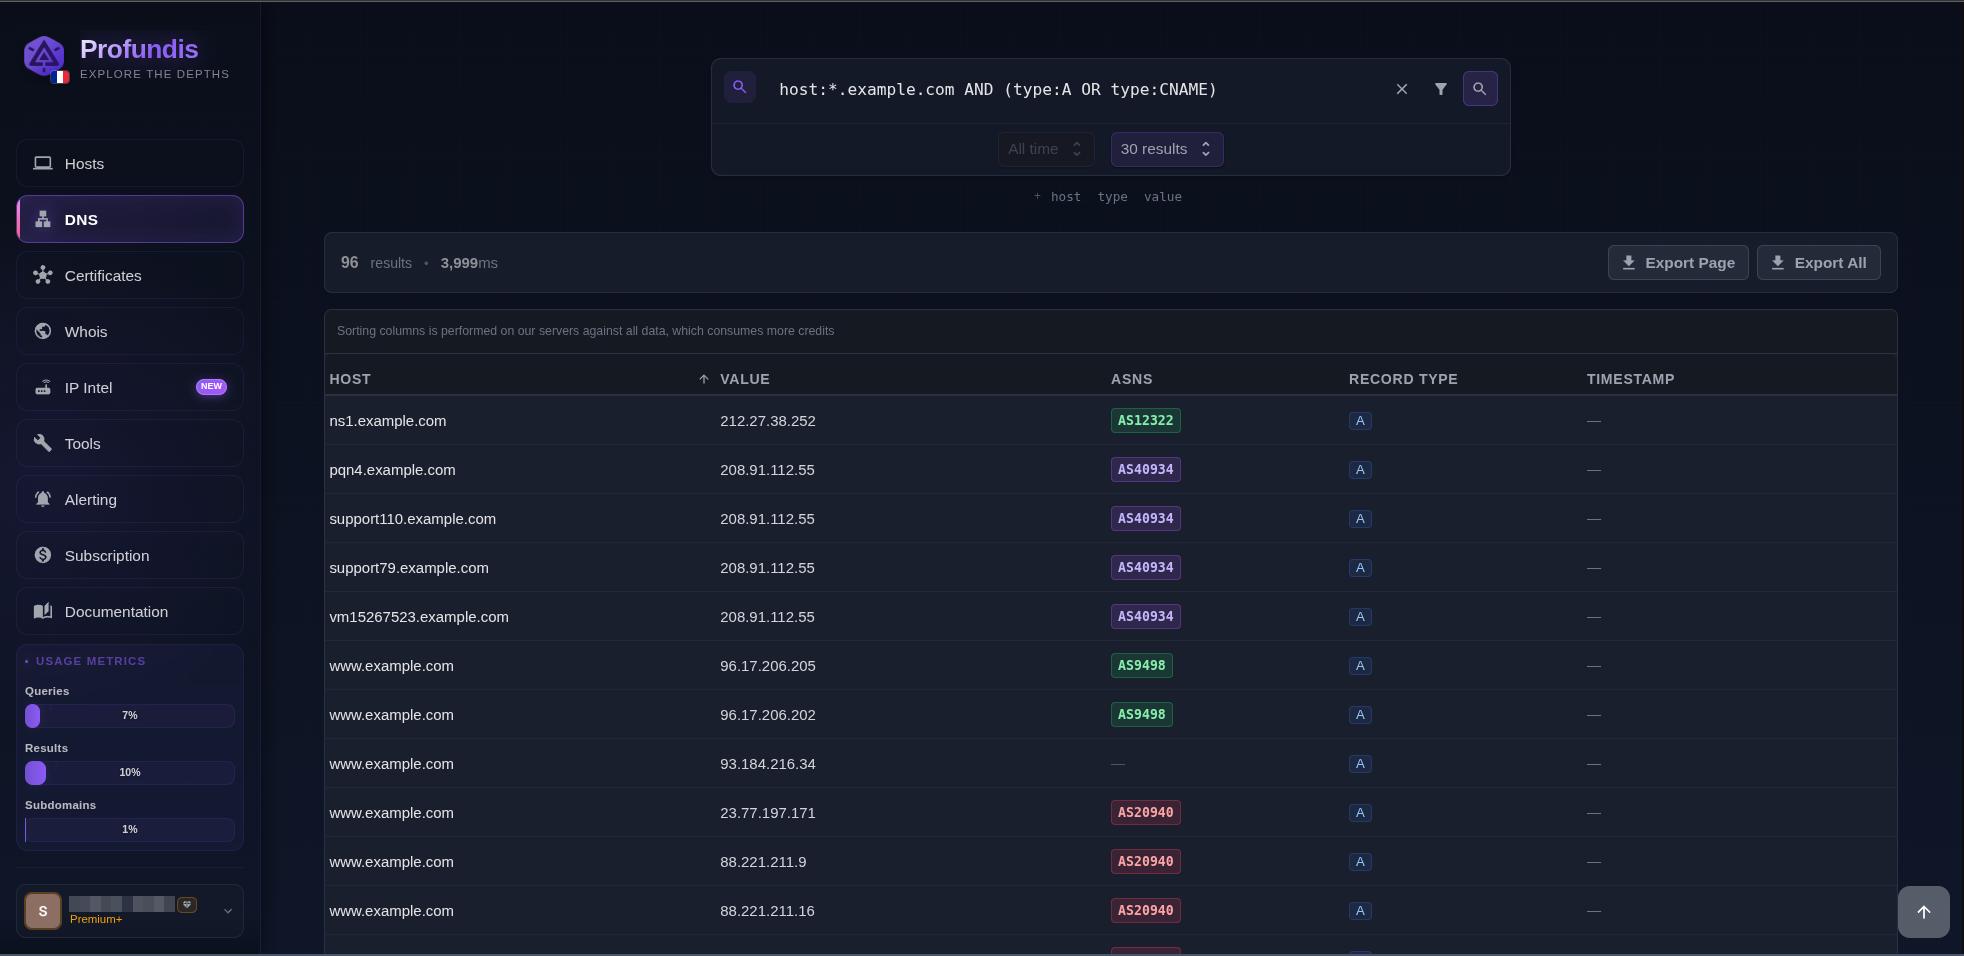 DNS search on profundis.io
For every host probed, we chose to also store certificates data independently, making profundis.io a powerful alternative to crt.sh with faster queries and more features like the ability to search for alternative SAN using the IP/domain resolution.
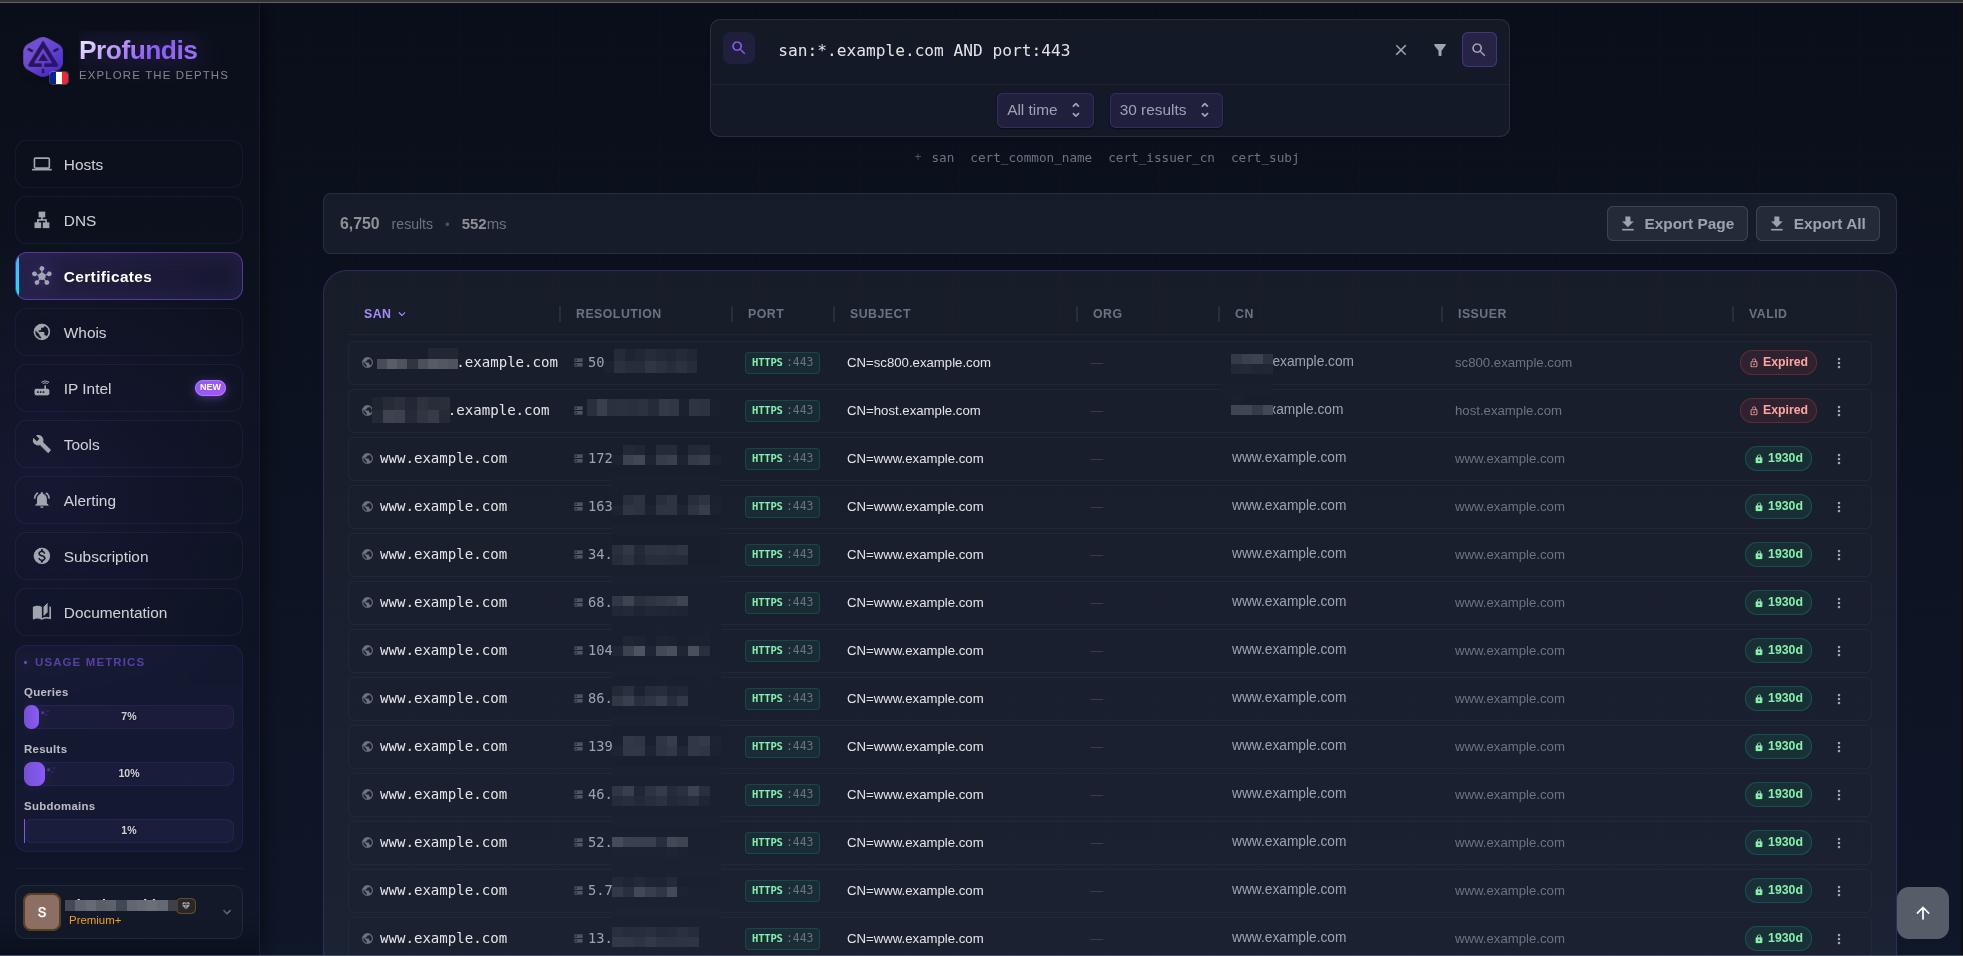 vHost search on profundis.io
One of the most powerful features of Profundis is its ability to alert you when a new asset is discovered. You can create alert tasks based on one of multiple fields using regexps.
We continuously ingest data and process each host to check if it was already present in our dataset. The alerts are sent only for new hosts (not DNS) we didn’t already have (we evaluate the IP, host and port fields values to detect it was already known). You can get more information in our documentation.
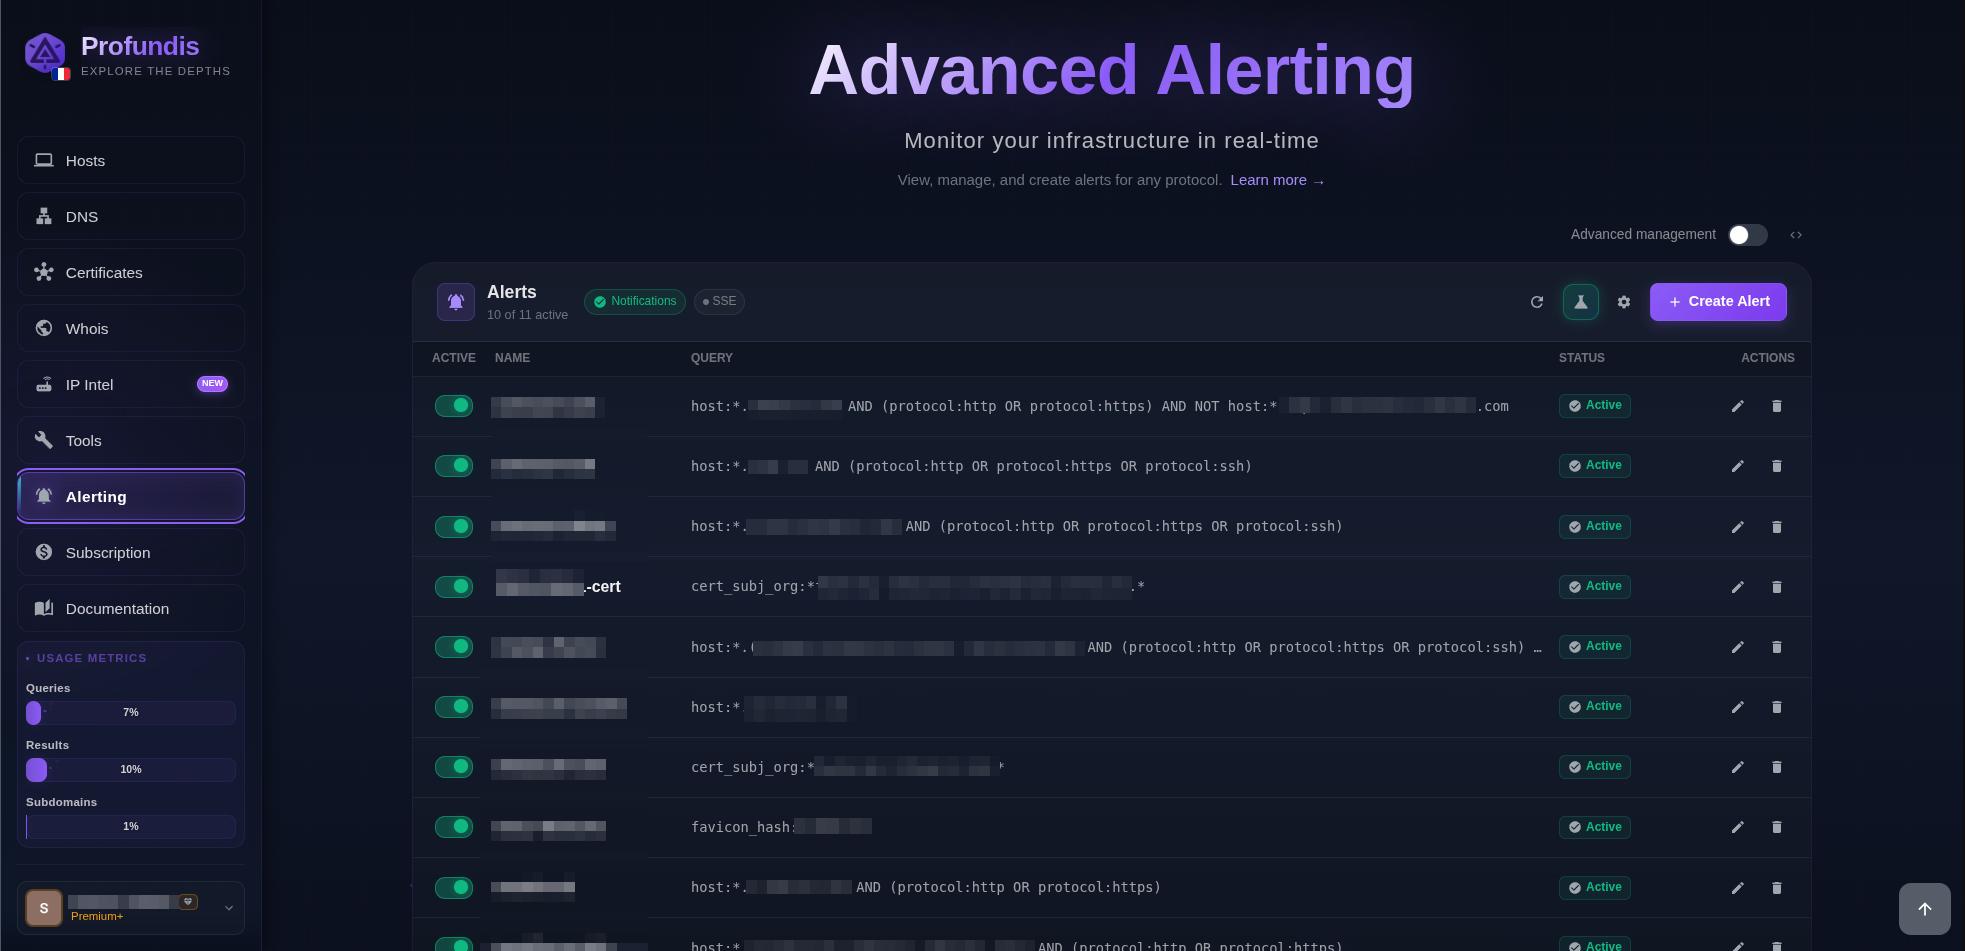 Alerts menu on profundis.io
What’s next
What should our next article be about?
- How we achieved sub second queries on our search engine while using wildcard searches across billion of hosts and DNS records?
- How our alerting system can notify you the next second a new asset is discovered while alternative tools can just send you an alert once a day?
- Or something else, you tell us!
You don’t need terabytes of RAM and the latest Threadripper to start building your own recon infra. You already have your gaming computer. Add some RAM sticks, enable nested virtualization, and install a Proxmox VE. Or you can trust us to do the work for you and start exploring terabytes of public data at profundis.io!